


LPR, Make, Model, Color picked by cameras
As a car enters, a fixed LPR camera captures its plate, make, model, and color, instantly relaying the data to the SpotGenius system.
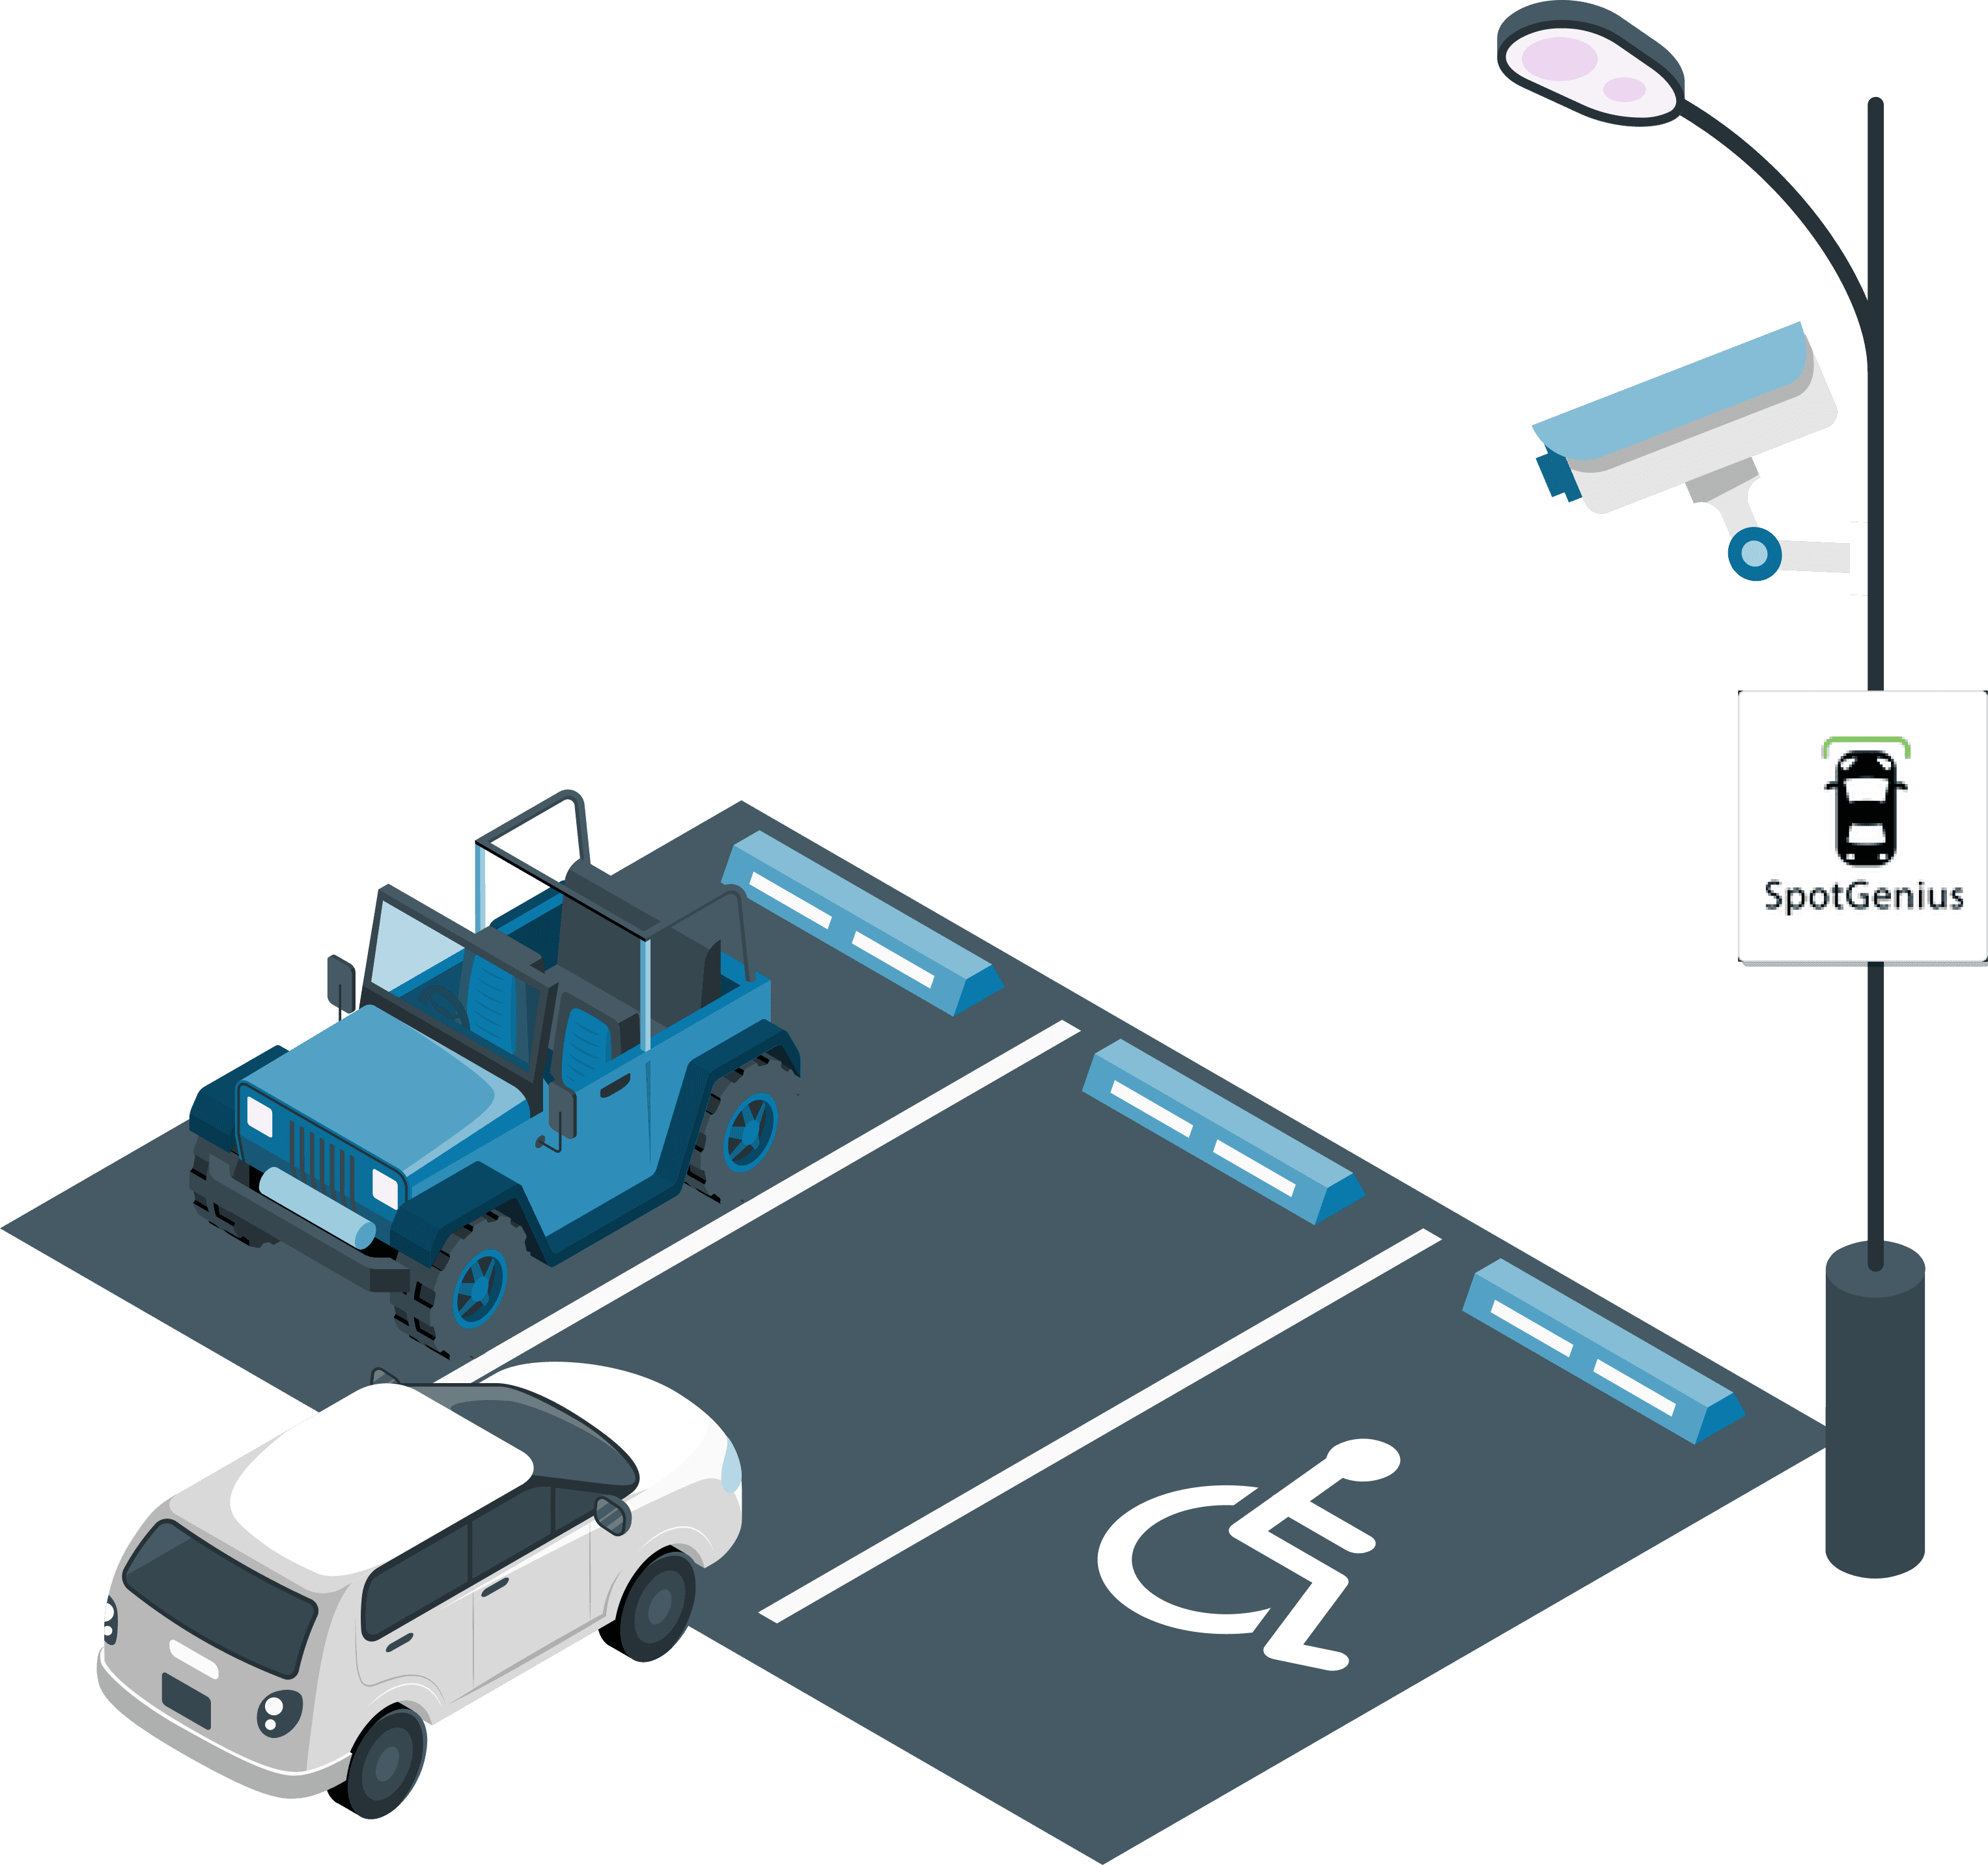
Using AI, cars are detected to its parked spot
Our AI accurately identifies each vehicle, pinpoints its exact parking spot, and captures detailed information about the car.
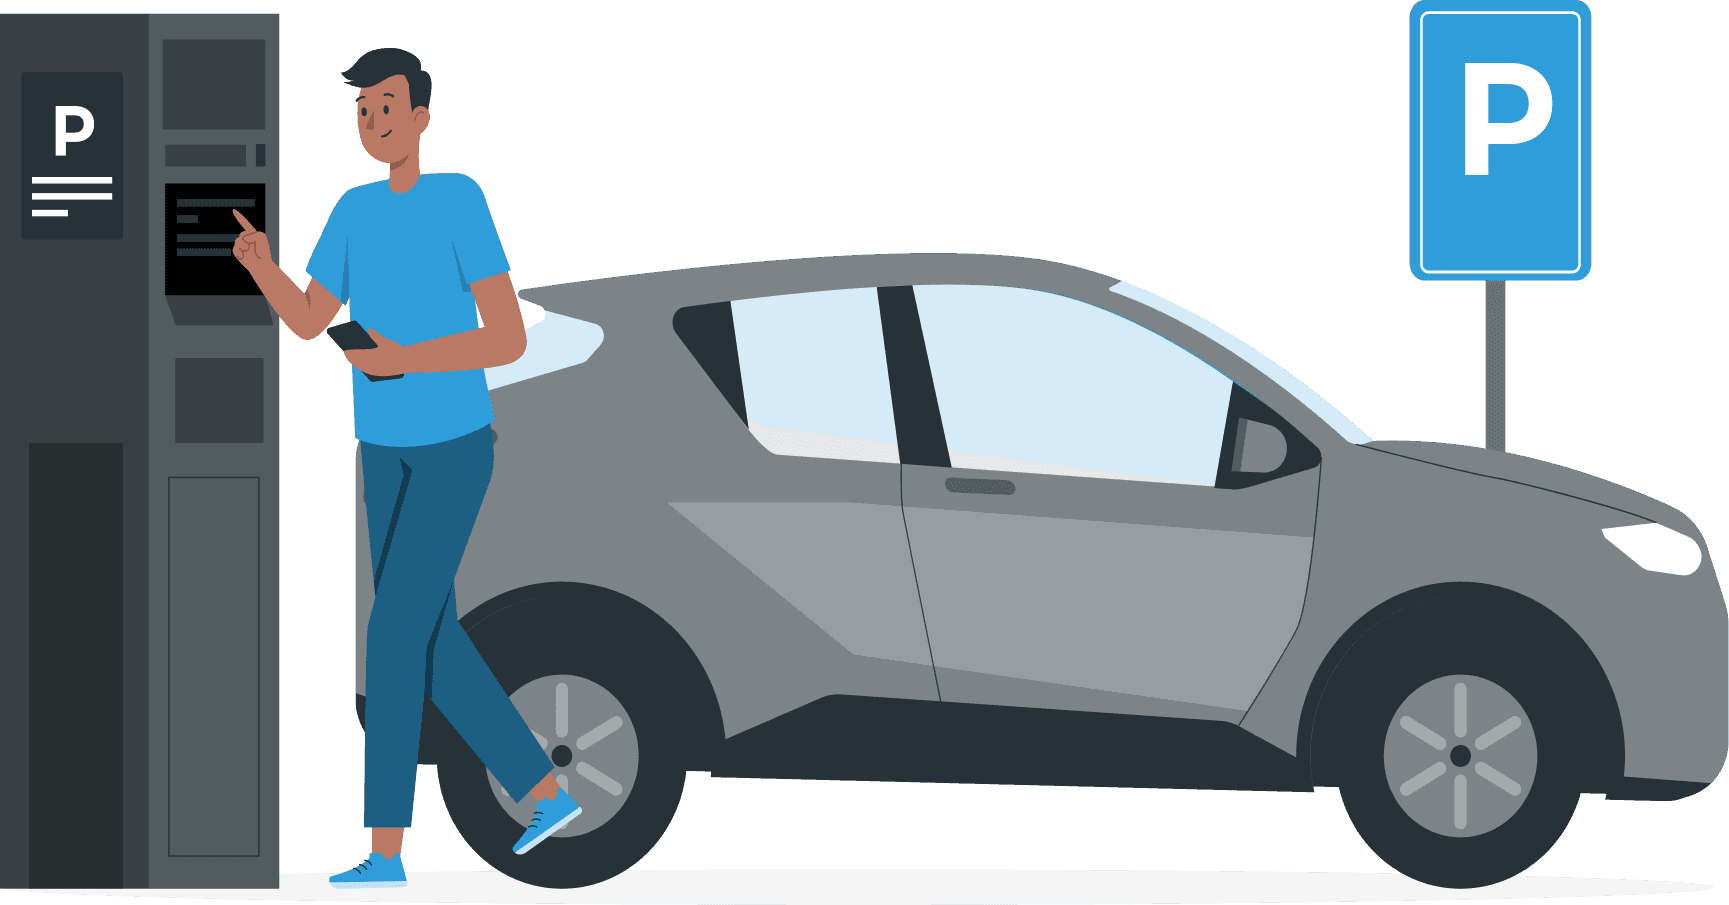
Transient payments, reservation, permit parking abilities
Paid transient and monthly/permit parking integration with reservation capabilities.
Real-time information from various databases
Spot Genius Cloud Processing connecting systems provides real-time data by pulling through different data bases.
Violation Enforcement and Alerts
Handheld
SMS and Email Alerts
Ticket by mail
Text w link to pay Scofflaw
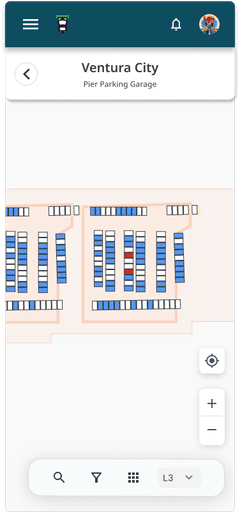
How to visually showcase a multi-level parking structure on Google Maps without having GPS coordinates
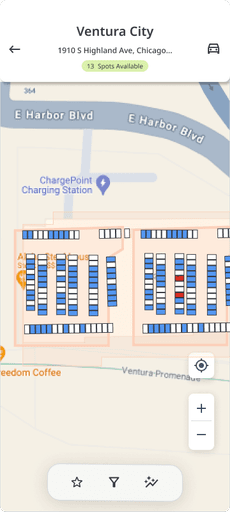
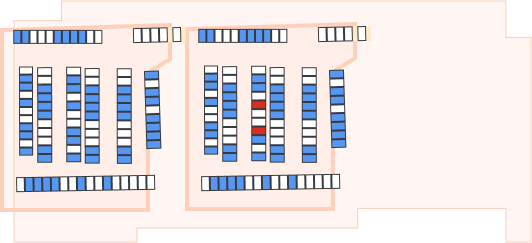
Determining how to illustrate a multilevel parking structure in contrast to an open parking area on the digital map that is superimposed on Google Maps, where each parking space is precisely marked using GPS.
Room to play with opacity
Constraints: Visually consistent with Google maps

Progress chart to indicate the overall availability of the structure so that the user can make an informed decision
When we began considering multilevel parking structures, we realized we needed to add some new controls. First, upon entering a building structure, users should be able to select which floor they're viewing and switch between floors easily.
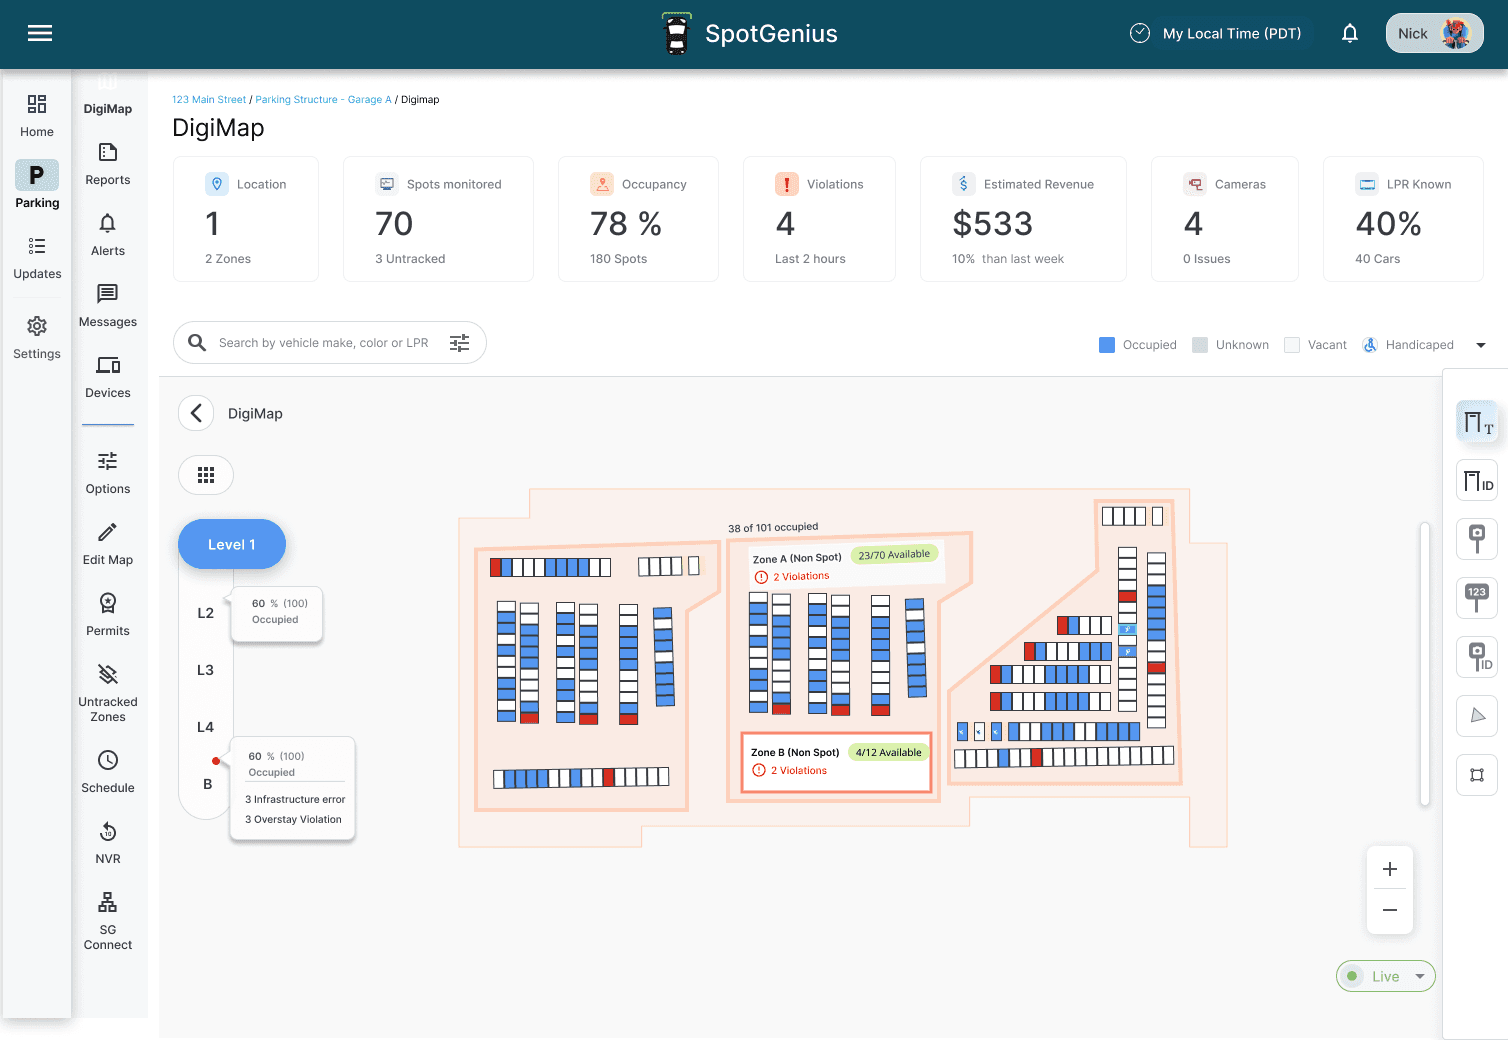
The level selector display the alerts happening on different levels in real-time.
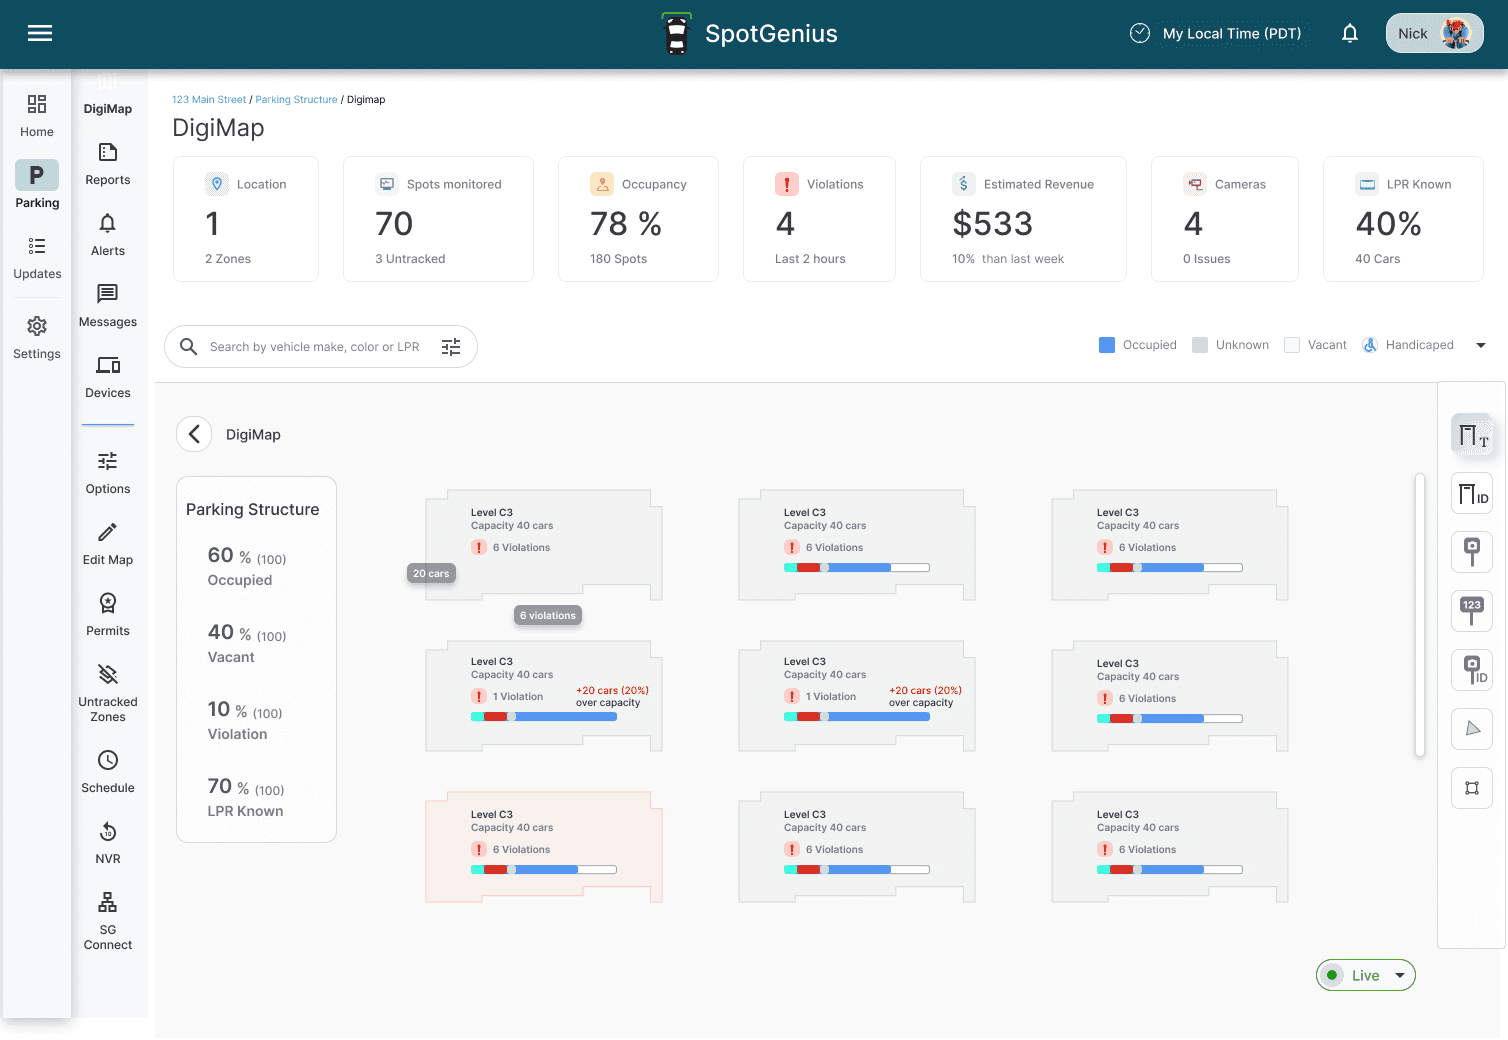
Having the levels in a grid format allowed the user to make the decision of which level to enter
Introduced Consolidated controls at the bottom
Operator
Level selector
Users should have the ability to toggle between the grid view and the digital map view.
End User
The bottom bar adapts when switching between standard and multi-level parking lot views.
"Park My Car" which remains at the top due to its conditional presence and save-action nature
SpotGenius, a startup, was originally constructed solely by coders. As the inaugural UX Associate, the task of reworking the UI for improved clarity and to allow for longer numerical values, if necessary, fell to me.


Previous glance bar layout offered minimal context to the stats and seemed to lack foundation with floating icons
Occupancy
78 %
180 Spots
Violations
4
Last 2 hours
Number of spots
Aided with icons and supporting text.
No. Sessions
7
Today
Occupancy
67%
Today
Avg Dwell Time
1hr 30 min
2%
than last week
Longest Dwell
3hr
10%
2hr 41min
Shortest Dwell
21min
10%
36 min

Horizontally scroll to arrange statistics according to importance
Optimizing for mobile was a challenge
A zone in any parking lot is defined by drawing a property line and then outlining a specific area designated as a parking area, which we refer to as a Zone. Zones can be of different types:
Zone
Car Counting Zones:
Recently enhanced, these zones track the overall number of vehicles in the area rather than individual spots. This method provides a broader view of parking lot usage. ROI (Region of Interest) Zone, which leverages the camera’s field of view
Exploration
Selected Design
Zone B (Non Spot)
4/12 Available
2 Violations

3.Pickup and Drop-Off Zones:
These zones are specifically designed for areas where vehicles temporarily stop to pick up or drop off passengers.
Double parked
It was essential for us to alternate between floors of the multi-level structure without the need to return and choose a different floor. The conception of controls for the web resembled that of elevator buttons.
Web level switcher

Mobile level switcher

Other projects